|
Welcome to website of Arun D. Upadhyay |
||
| | Home | Personal Statement | Summary of Chapter1 | Project1(a) | Project 1(b) | Case1 | Assignment on Regression Analysis | Project: 2 | Project 3(a&b) | Project 4 | |
|
Project: 2
|
|
|
Project 2 Part 1 - Objective The objective of this project is to analyze the data set provided and develop a model that
would help predict firm demand. Predicting firm demand will enable the firm plan its marketing and sales goals, which will
ultimately lead to manage its finance as well as manufacturing operations in an effective and more efficient way. The basic mathematical equation that will be used is: Firm Demand (FD) = Total Industry Demand (TID)*Market Share(MS) = TID *RD/N
The key variables of interest that will be used to develop the models are outlined below:
TID = Total Industry Demand - useful in
determining overall market growth The provided dataset will be used to develop models that will help in estimating TID &
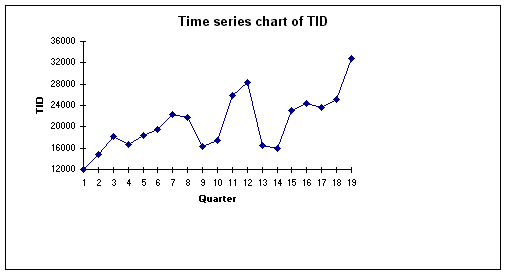
RD. TID as a function of time as well as Average Price/Average Advertising Part 2 - Description of Variables TID Variables Total Industry Demand (TID) - Trend Analysis
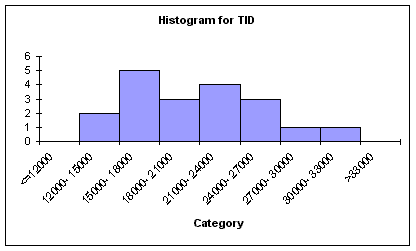
As seen from the above histogram, TID is mainly distributed in the $15000 to $30000 range.
Total Industry Demand(TID) - Summary Measures Count 19.000 Mean 20677.895 Median 19580.000 Standard deviation 5233.006 Minimum 12020.000 Maximum 32850.000 Range 20830.000 Average Price - Trend Analysis
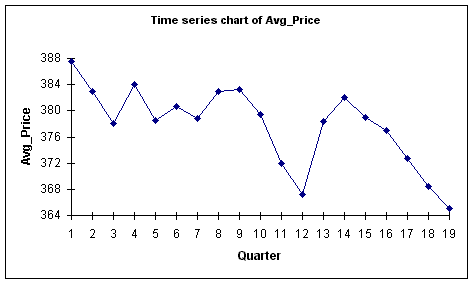
As seen from the above chart, Average Price has decreased consistently for the most
part. There have been quarters where the Average Price has increased sporadically.
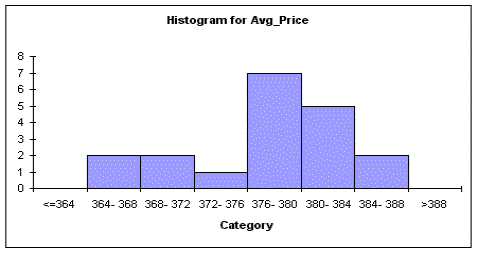
As seen from the above histogram, Average Price is mainly distributed in the $376 to
$388 range. Average Price - Summary Measures Count 19.000 Mean 377.784 Median 378.900 Standard deviation 6.103 Minimum 365.000 Maximum 387.500 Range 22.500 Average Advertising Expenditures - Trend Analysis
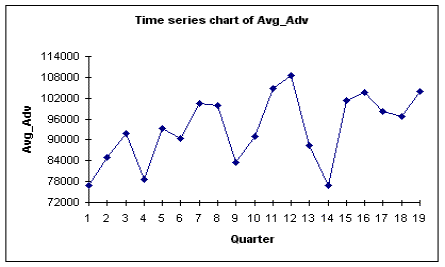
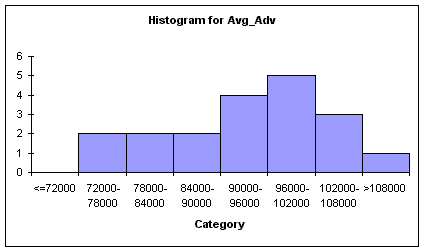
Average Advertising - Summary Measures Count 19.000 Mean 93325.789 Median 93400.000 Standard deviation 9828.045 Minimum 76800.000 Maximum 108570.000 Range 31770.000 The charts above indicate that the mean Average Advertising expenditure is $93,326 with a
standard deviation for the dataset being $9828. The line graph shows that there has been a slight increase over time with
several sharp spikes (dips) in the average advertising expenditures. The maximum value for the dataset is $108,570 and occurs
in Q12 while the minimum value for the dataset is $76,800 and occurs in Q1. Correlation Matrix of TID, Average Price, Average Advertising and Quarter The table below outlines the correlation matrix of the variables discussed above. Quarter Avg_Price Avg_Adv TID Quarter 1.000 Avg_Price -0.703 1.000 Avg_Adv 0.522 -0.749 1.000 TID 0.695 -0.889 0.882 1.000 Based on the correlation coefficients, the following conclusions can be made : Based on the above conclusions, it makes sense to perform regression
analysis using the following variables : RD Variables Please refer to Part 1 for description of RD, PREL, AREL &
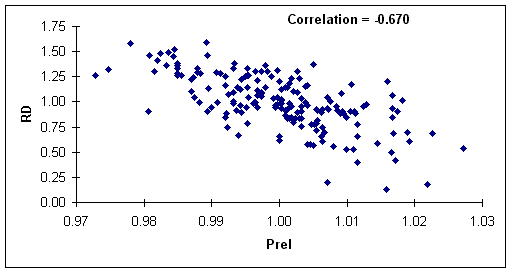
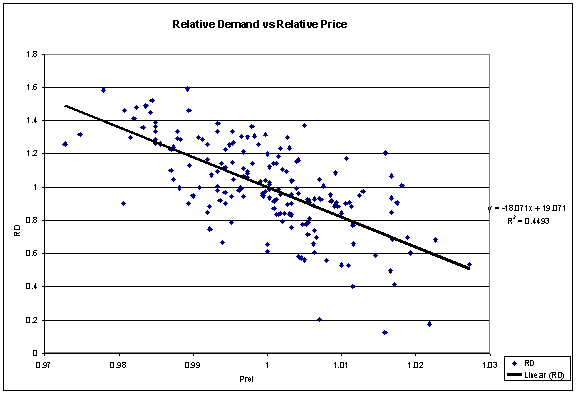
RD1 as well as their significance. Scatter Plot between RD and PREL
From the scatterplot above, it is obvious that there is a strong
inverse correlation between RD & PREL. This was my guess even prior to looking at the dataset. By theory of demand,
as price increases demand deceases and vice versa. This RD versus PREL scatterplot just confirms the theory of demand. Scatter Plot between RD and AREL
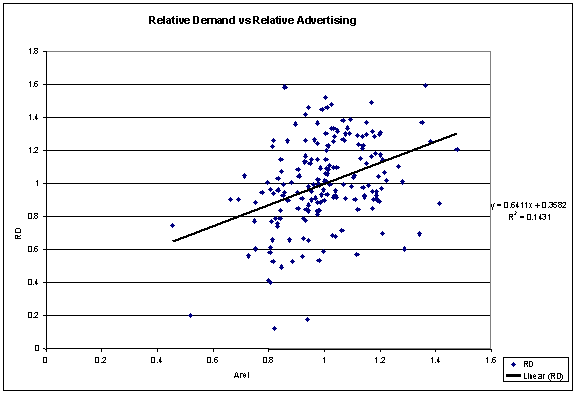
The above scatterplot above indicates that RD & AREL are
not strongly correlated. Therefore, increase in advertising expenditures does not directly influence the relative demand for
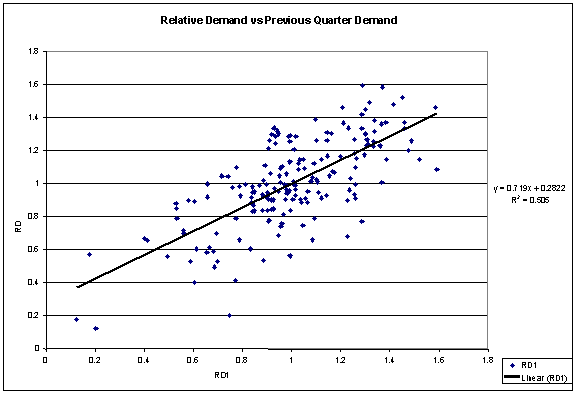
the firm's product. Scatter Plot between RD and RD1
The above scatterplot indicates that RD and RD1 are strongly
correlated. This is suggestive of the fact that customers tend to be brand loyal and is also one of the reasons why advertising
is not causing significant influence on customers who might be loyal to existing brands. Scatter Plot between RD and PREL
Since PREL and RD1 are weakly correlated, it would actually make
sense RD as the response variable and PREL as well as RD1 as the predictor variables for performing the regression analysis. Part 3 - Mathematical Modeling: Regression Analysis to estimate TID using Quarter (time) as independent variable The following information was obtained using the dataset provided. Summary measures Multiple R 0.6947 R-Square 0.4825 StErr of Est 3873.4474 ANOVA table Source df SS MS F p-value Explained 1 237857200.1754 237857200.1754 15.8533 0.0010 Unexplained 17 255061115.6140 15003595.0361 Regression coefficients Coefficient Std Err t-value p-value Constant 14218.0702 1849.8304 7.6861 0.0000 Quarter 645.9825 162.2409 3.9816 0.0010 The p-value for the independent variable is 0.001 which is indicative
of the fact that the probability of a type 1 error is very low and hence there is a likely relationship between the variables
under study. Based on the data above, the model for TID is : TID = 645.9825Quarter+14218.0702 The R2 figure indicates that only 48% of the variance
in TID is explained by this model. Regression Analysis to Estimate TID Using Quarter, AvgPrice and AvgAdvertising as Predictors The following information was obtained using the dataset provided : Summary measures Multiple R 0.9523 R-Square 0.9069 Adj R-Square 0.8883 StErr of Est 1748.7163 ANOVA Table Source
df SS MS F p-value Explained 3 447048187.7895 149016062.5965 48.7298 0.0000 Unexplained 15 45870128.0000 3058008.5333 Regression coefficients Coefficient Std Err t-value p-value Constant 130249.2813 50620.0664 2.5731 0.0212 Quarter 132.2283 102.9947 1.2838 0.2187 Avg_Price -358.6135 122.1832 -2.9350 0.0102 Avg_Adv 0.2634 0.0633 4.1628 0.0008 Based on the data above, the model for TID is : TID = 130249.2813+132.2283Quarter-358.6135(Avg.Price)+0.2634(Avg.Advertising) An R2 value of 90.69 indicates that the model explains approximately
91% of the variance in TID value. The p-values for Average Price and Average Advertising are 0.0102 and 0.0008 respectively.
The adjusted R2 value is 88.83%. Recommended Model for Estimating TID Each model has its own merits. The first model is just a function
of quarter and hence is easier to measure though it is less predictive as compared to the second model. The second model which
is a function of quarter, Average Price and Average Advertising is obviously more difficult to measure because of the fact
that three variables are needed to estimate TID. However, due the high values of R2 as well as adjusted R2 values of the latter
model, the latter model is the recommended choice for estimating TID in this problem. Regression Analysis to Estimate RD Using PREL, AREL and RD1 as Predictors Results of multiple regression for RD Summary measures Multiple R 0.9785 R-Square 0.9575 Adj R-Square 0.9568 StErr of Est 0.0560 ANOVA Table Source df SS MS F p-value Explained 3 12.3699 4.1233 1314.6130 0.0000 Unexplained 175 0.5489 0.0031 Regression coefficients Coefficient Std Err t-value p-value Constant 16.1300 0.4445 36.2862 0.0000 PREL -16.4445 0.4441 -37.0255 0.0000 AREL 0.7796 0.0269 28.9347 0.0000 RD1 0.5334 0.0164 32.4615 0.0000 Based on the data above, the model for RD is : RD = 16.13-16.44PREL+0.7796AREL+0.5334RD1 An R Square value of 95.75% indicates that the model
explains approximately 96% of the variance in RD value. The t-values and p-values of coefficients are summarized in
the above table. FD Model: As discussed earlier, the firm demand is described by the equation below: Firm Demand(FD) = Total Industry Demand(TID)*Market Share(MS)
= TID *RD/N Since optimal models for estimating TID and RD have been developed,
arriving at a model for FD is just a matter of plugging in values for TID and RD in the above equation .Therefore, FD = TID*RD/N where TID = 130249.2813+132.2283Quarter-358.6135
(Avg.Price)+0.2634(Avg.Advertising) Conclusions Since we have developed models for estimating TID, RD and FD,
it should be fairly easy transform this mathematical model into a spreadsheet model. Spreadsheet models are better than mathematical
models because they provide instant feedback and prevent the end user from worrying about low level mathematical details.
So, in effect a Decision Support System (DSS) has been developed to help estimate Firm Demand which would in turn facilitate
the firm to plan production schedules, manufacturing requirements, project financial revenues, estimate costs and make decisions
on pricing, advertising, budgets etc.
|
|||||||||||||||||||||||||||||||||||||||||||||||||||||||||||||||||||||||||||||||||||||||||||||||||||||||||||||||||||||||||||||||||||||||||||||||||||||||||||||||||||||||||||||||||||||||||||||||||||||||||||||||||||||||||||||||||||||||||||||||||||||||||||||||||||||||||||||||||||||||||||||||||||||||||||||||||||||||||||||||||||||||||||||||||||||||||||||||||||||||||||||||||||||||||||||||||||||||||||||||||||||||||||||||||||||||||||||
|
|
|||||||||||||||||||||||||||||||||||||||||||||||||||||||||||||||||||||||||||||||||||||||||||||||||||||||||||||||||||||||||||||||||||||||||||||||||||||||||||||||||||||||||||||||||||||||||||||||||||||||||||||||||||||||||||||||||||||||||||||||||||||||||||||||||||||||||||||||||||||||||||||||||||||||||||||||||||||||||||||||||||||||||||||||||||||||||||||||||||||||||||||||||||||||||||||||||||||||||||||||||||||||||||||||||||||||||||||